
top of mind news
- Maximize Restaurant Profits With A Happy Hour Menu
- The Restaurant Critic’s Job Has Changed … Maybe Forever
- How To Respond To Negative Reviews
- How To Navigate Negative Restaurant Reviews
- 10 Ways Independent Restaurants Can Offset Minimum Wage Hikes
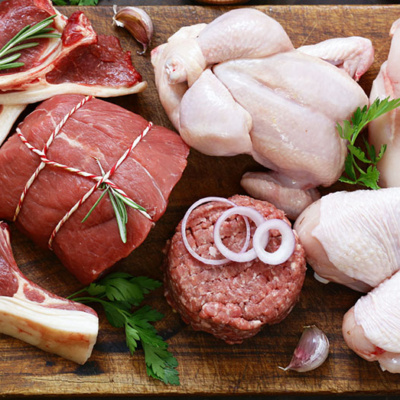
Poultry
 Weekly chicken slaughter for the week ending April 17th was revised down from initial estimates, with the 162.5 million head harvested and was 3.5 million head smaller than forecasted. Last week’s harvest was, again, estimated at 166.9 million head, and, if realized, would be 2% to 3% larger than 2019 levels, and we continue to look for an uptick on production into the late spring to early summer. Pricing across the parts remains steady to firm, with reports of export interest continuing to underpin significant strength across the leg quarters. Breast meat and tenders, as well, are finding strength on active interest, but the buying surge has been domestic strength rather than exports. Anticipate larger broiler production schedules to temper prices ahead.
Beef
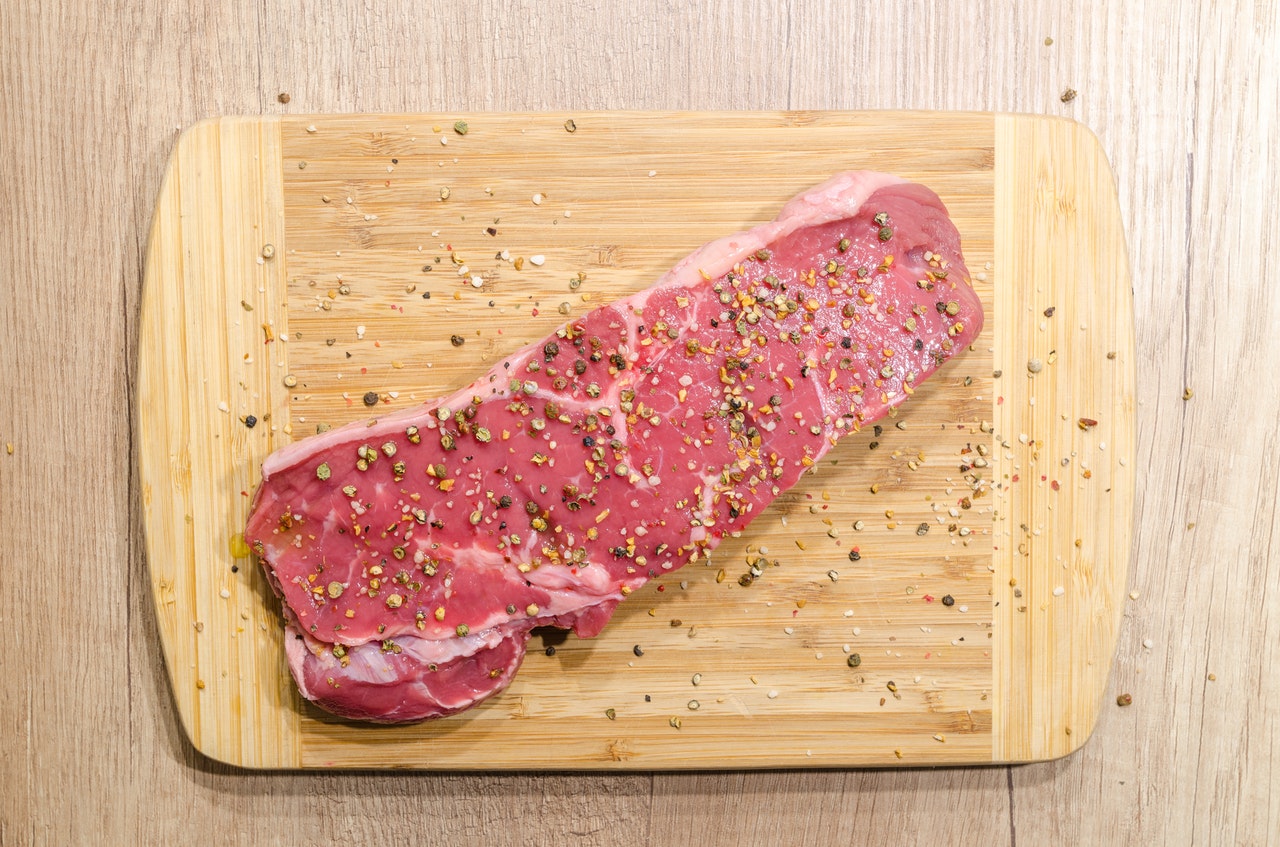
Last week’s slaughter, at 665,000 head, was the third largest of the year, but the most for the respective week since 2008. While we expected flat-ish beef production in the 640-to 650,000-head range, widening packer margins amid higher beef prices and stalling live cattle costs continue to incentivize big output. The growth in beef production may help to temper some of the recent price increases into the late spring, but the beef markets typically move towards a seasonal peak in May or June. While the middle meats have led the recent rally, look for the beef 50s to find price support as well as reemerging buying interest.
Pork

Last week’s hog harvests held in line with expectations, and, at 2.47 million head, and was up about 4% from 2019 levels. Seasonally, slaughter levels are expected to fall about 5% from here into the early summer lows, which this year would still indicate that the wholesale pork markets will remain strong as supplies will still be tight well into the early summer timeframe. But, the pork trim markets are now easing, with the 42s dropping below $0.80 while the 72s have retreated back below $1.200 but trim prices usually find support in the summer.
THE SEA
Seafood

The shrimp markets have mostly trended below year ago levels with solid shrimp imports. During February, U.S. shrimp imports were 2.5% above the previous year. Shrimp demand worldwide is anticipated to escalate later this year due to better foodservice demand and inflated alternative protein prices including beef and pork. This could be supportive of the shrimp markets.
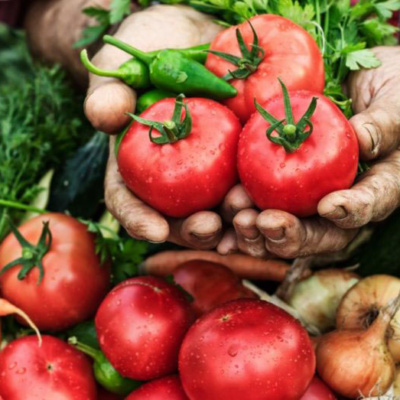
THE GARDEN
Produce

The lettuce markets continue to trade at relatively engaging levels for buyers. The chief harvest area has transitioned to the Salinas California region which will produce the bulk of the product for the next several months. Existing lettuce supplies are adequate, but demand is improving, and supplies could tighten some in the near term. Growers will not be in a hurry to over produce at these price levels either. All of this suggests that the risk in the lettuce markets is to the upside. Freight rates continue to escalate due to short truck availability.
THE KITCHEN SINK
Dairy

CME spot butter prices last week experienced the lowest weekly close in four weeks. CME spot cheese prices were firm last week with barrels being the highest since November. Per the USDA, U.S. March milk production was up 1.8% (y/y) and was the largest for the month on record. The milk cow herd was up 0.8% (y/y) and was the biggest for the date since 1995. Plentiful milk supplies should support solid cheese and butter output going forward. But, robust food service dairy demand, especially recently for cheese, may keep the dairy product markets firm. Typically cheese and butter prices appreciate in May.
Grains

The grain markets have made another surge upward during the last week with corn leading the way. Both nearby corn and soybean futures have traded at their most expensive levels in over six years. These inflated prices will continue to incentivize farmers to plant and ration demand, but prices will likely remain supported in the near term.
Oil

Nearby natural gas futures last week finished up (w/w) and were the highest since early-March. As of the week ending April 16th, U.S. natural gas stocks were down 11.8% (y/y). Since 2016, natural gas prices averaged 2.0% higher in May (m/m).